Outward
Market intelligence
What’s happening on the street? Demand, competition, prices and absorption by neighborhood, from Zonalia’s event history, INEGI data and public sources, to know what sells, where and at what price.

Real estate intelligence for developers · Mexico City
Zonalia reads the Mexico City market neighborhood by neighborhood and connects it to your financial model, so buying land, defining the product, setting the price and adjusting sales are decided with data.
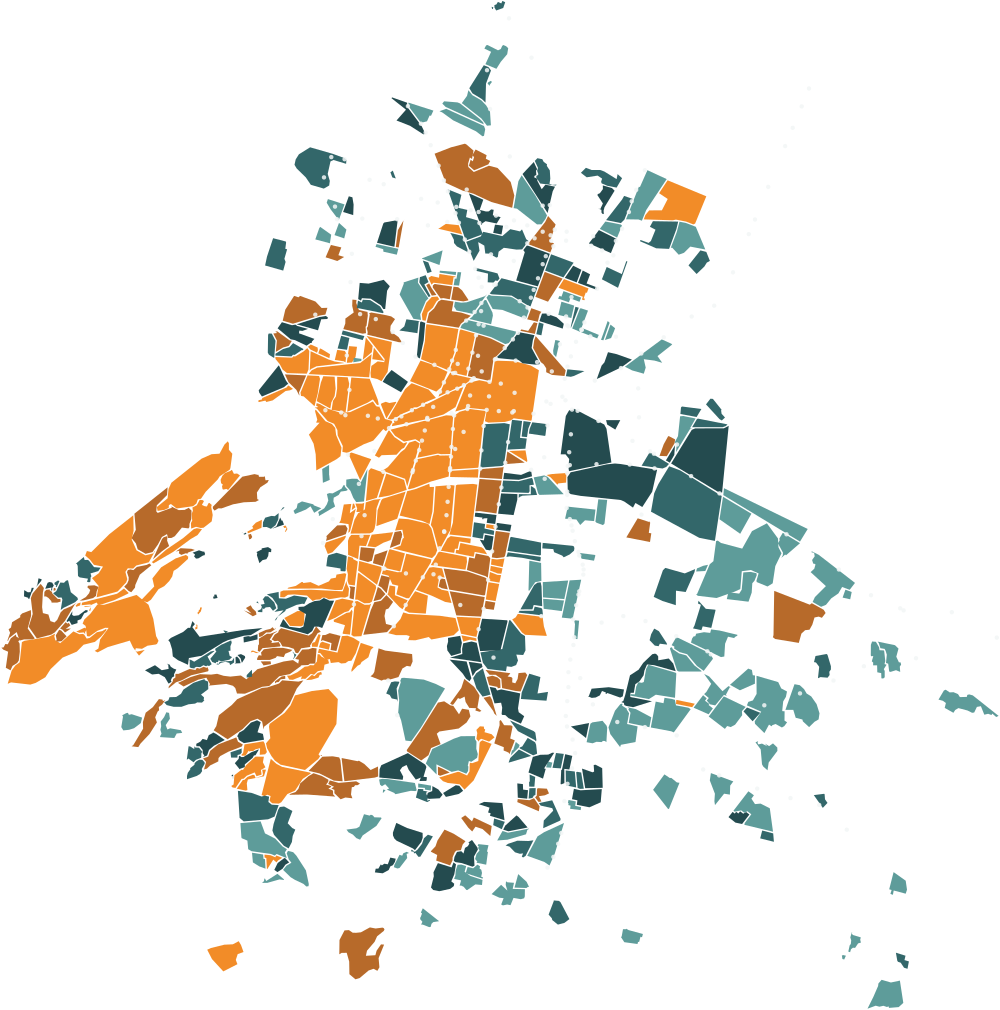
This is how price per m² spreads across the city. Your area is reviewed in detail with you in the session.
What Zonalia is
A market study is delivered once and goes stale; a project takes years to sell. With Zonalia, the market is followed continuously and what happens on the street is connected to your project’s numbers.
Outward
What’s happening on the street? Demand, competition, prices and absorption by neighborhood, from Zonalia’s event history, INEGI data and public sources, to know what sells, where and at what price.
Inward
What’s happening in your model? Feasibility, capital structure, liquidity and pre-sale targets. Zonalia ties them to real market assumptions.
Market data adjusts the model, the model sets price and pre-sale targets, and monthly tracking watches both.
What you decide with Zonalia
Should I buy this land? What product works here? Is it profitable?
A wrong estimate of land price or product mix is paid for over the whole project.
What you get
What price do I launch at, how do I step it up, and what pre-sale target do I commit to the bank?
A poorly set launch price stretches the sale and makes the construction loan more expensive.
What you get
How am I doing against the market? When do I adjust price, pace or product?
Spotting a slow project early costs less than fixing it later.
What you get
What the market already says
Among the factors measured for each neighborhood, the number of offices within 1 km is what most strongly tracks price per m², followed by street life and health services, among others.
A model built on these factors explains 41% of the price difference between neighborhoods.
How it works
You share your project or the area you’re evaluating, and Zonalia replies to set up a meeting.
The project, the open decisions and the area of interest are reviewed.
After the first session, Zonalia shares examples of the deliverables so you can see how your project would be read.
Try the Zonalia platform with your neighborhoods and your assumptions, and then decide whether Zonalia backs your project.
How data is interpreted
Zonalia reads listings from several portals, removes duplicates and keeps each property’s history. When one stops appearing it is marked as a likely sale, not a confirmed one, and this is always shown next to the number.
Contact
Write to Zonalia about your project and where it stands, and Zonalia will reply to set up a conversation.
info@zonalia.net
Share which project or area you’re evaluating and where it stands: looking for land, defining the product, about to launch pre-sales or selling.